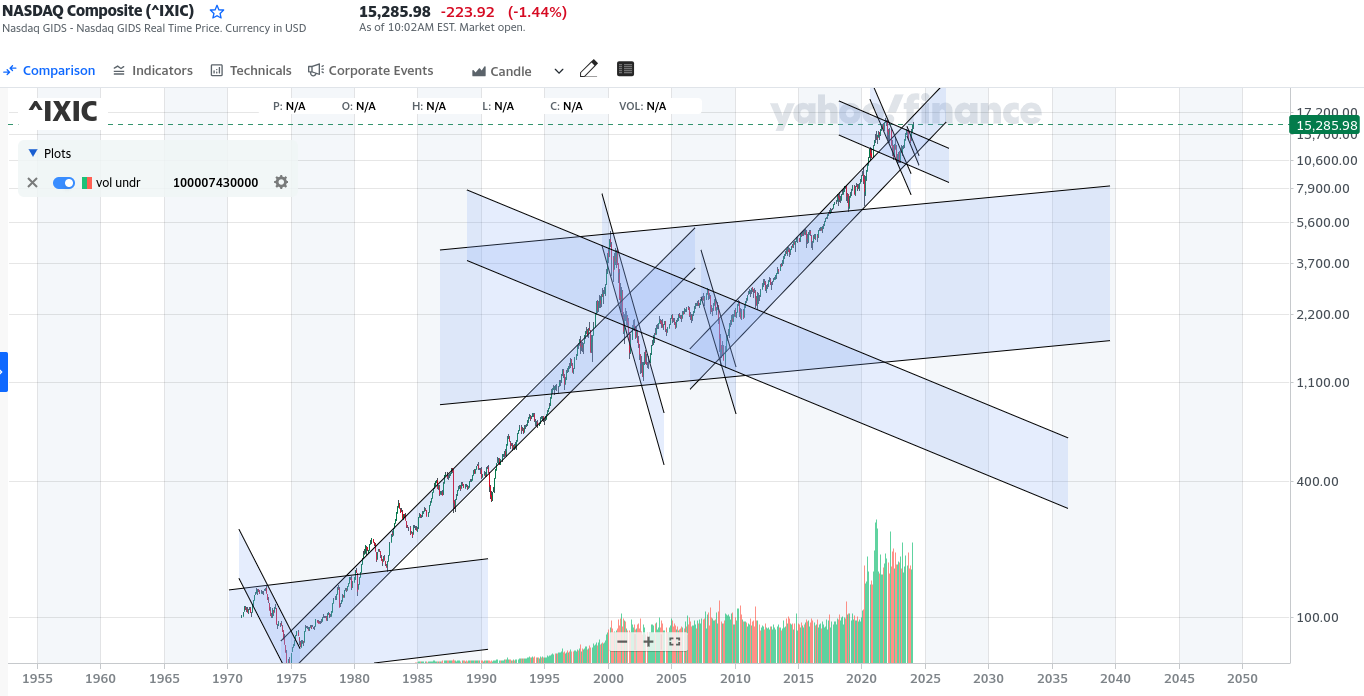
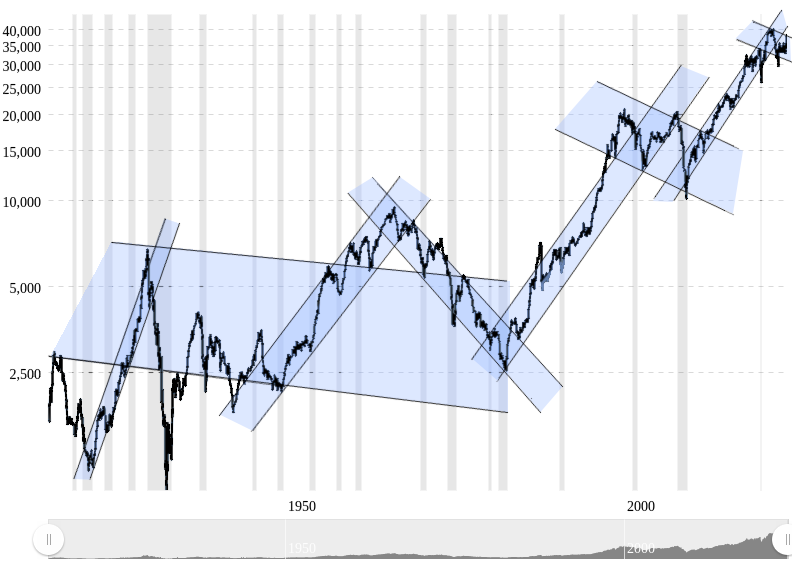
Trend channels in financial markets are formed as a result of the collective actions and decisions of market participants, especially regarding the points at which they’ve previously bought and sold vis-a-vis inflation, retirement goals, annual profit/loss, etc. Over time, generational and socio-economic patterns develop. Prices often return to test the tops and bottoms of trend channels. It’s not always obvious whether you’re within a larger trend unless you zoom out.
Monthly:
Weekly:
Daily:
Many factors contribute to the creation of trend channels:
Supply and Demand:
Uptrends: When demand for an asset exceeds its supply, prices tend to rise. This may occur due to positive developments such as strong earnings reports, favorable economic conditions, or positive sentiment about a particular sector.
Downtrends: Conversely, if there is more supply than demand, prices tend to fall. Factors such as poor earnings, economic downturns, or negative sentiment can contribute to increased selling pressure.
Technical Indicators:
Traders often use technical analysis to identify trend channels. Moving averages, trendlines, and chart patterns help in visualizing and confirming trends. Breakouts and breakdowns from these technical levels can signal the continuation or reversal of trends.
Investor Sentiment:
Positive or negative investor sentiment can strongly influence market trends. Sentiment is often influenced by news, economic indicators, or geopolitical events. Bullish sentiment can drive uptrends, while bearish sentiment can lead to downtrends.
Economic Cycles:
Economic cycles play a crucial role in shaping market trends. During economic expansions, businesses thrive, leading to increased profits and positive market trends. Conversely, economic contractions can result in downturns.
Human Nature:
Behavioral finance emphasizes the role of human emotions in financial decision-making. Fear and greed can drive market movements, contributing to the formation and persistence of trend channels. Investors' reactions to perceived opportunities or risks can amplify trends.
Market Liquidity:
Liquidity, or the ease with which assets can be bought or sold, affects market trends. In illiquid markets, large trades can have a more significant impact on prices, potentially leading to sharper trends. Liquidity shortages can exacerbate volatility.
Generational Patterns:
The preferences and behaviors of different generations can shape market trends. For example, as older generations approach retirement, they may favor more conservative investments, influencing trends in certain asset classes.
Annual Profits and Losses:
Corporate performance and economic health contribute to annual profits and losses. Strong earnings, economic growth, and positive corporate outlooks can fuel uptrends, while economic downturns or poor corporate performance can lead to downtrends.
Socio-Economic Considerations:
Broader socio-economic factors, including government policies, income inequality, and societal trends, can impact market trends. Policies promoting economic growth or shifts in consumer preferences can influence specific sectors and contribute to trend channels.
Impact of Other Markets:
Developments in currency markets, commodity markets, interest rates, and global events can spill over into financial markets, influencing trends. Cross-market analysis is essential for understanding how external factors impact trends.
Trend channels in financial markets are the result of the complex interplay of all of these various factors. Traders and investors use a combination of fundamental and technical analysis to understand these dynamics and make informed decisions in the ever-evolving market environment.
The Nasdaq looks like it’s in a perpetual uptrend overall. We might expect something like that when considering inflation as a constant upward pressure on prices (see previous posts here on that). However, keep in mind also that the Nasdaq was founded in 1971 by the National Association of Securities Dealers (NASD), now known as the Financial Industry Regulatory Authority, and 53 years is simply not enough information to know whether larger trends are in play.
We can, however, look at other markets with a longer history to determine whether maybe the current 53-year uptrend in the Nasdaq is in fact a sub-trend in a larger formation. In fact, the trend in the Treasury market has just changed after essentially the same period. The uptrend in the Nasdaq largely coincided with a downtrend in interest rates. It would be a mistake to think that the Nasdaq will necessarily continue upward while interest rates have just shifted into what could very well be a multi-decade uptrend.
Another factor here playing into such trends is the generational composition of the workforce and retirement-age population. In fact, the entire trend period in stocks and bonds we’re looking at essentially encompassed the Baby Boom generation’s time in the workforce. Now that virtually all Boomers are retired and Gen Xers are on the verge of retirement, and Millennials and Zoomers are increasingly determining the workforce and corpus of investors, we’re moving into a new trend.
Prior to the Nasdaq, if you had bought the Dow Jones Industrial Average in 1929 and sold it the day the Nasdaq was established 42 years later, you’d have lost over 50% nominally, not even considering inflation.
The Great Depression downtrend through the Cold War was mostly the Lost Generation. You can see how a 1940s-60s uptrend coincided with the Greatest Generation and the 60s-80s downtrend mostly aligned with the Silent Generation. The 80s-2010s bull trends were the Boomers and GenX with the Great Recession coinciding with the Millennials entering the workforce and displacing Boomers. And the Zoomers have brought us the Meme Bubble. But according to the Strauss-Howe generational turnings theory (see previous posts here on that), the Millennials will repeat the general trends of the Lost Generation, suggesting that the Great Recession has only just started as Millennials will soon become the majority of the workforce and investment class. This suggests 20-40 years of general downtrend ahead of us like the 1930s-70s, which the Treasury market is already foreshadowing.
No market ever only goes up. With a new trend just getting underway, it’s important to keep that in mind.


